A freight rate usually arrives as a single number from a single phone call. Three forwarders quote Busan → Los Angeles and the buyer gets three figures with no way to tell which one is firm, which one is a guess wearing a suit, and which one already includes something the others left out. The difficulty is not picking between them. It is that the comparison has no common denominator.
That is a schema problem before it is a market problem. Uncertainty that lives in a disclaimer cannot be joined, filtered, or weighted, because it is prose. Put it in a column and it becomes usable: you can drop every value below a grade, weight a model by how wide its bands are, or refuse to aggregate across grades without noticing that you did.
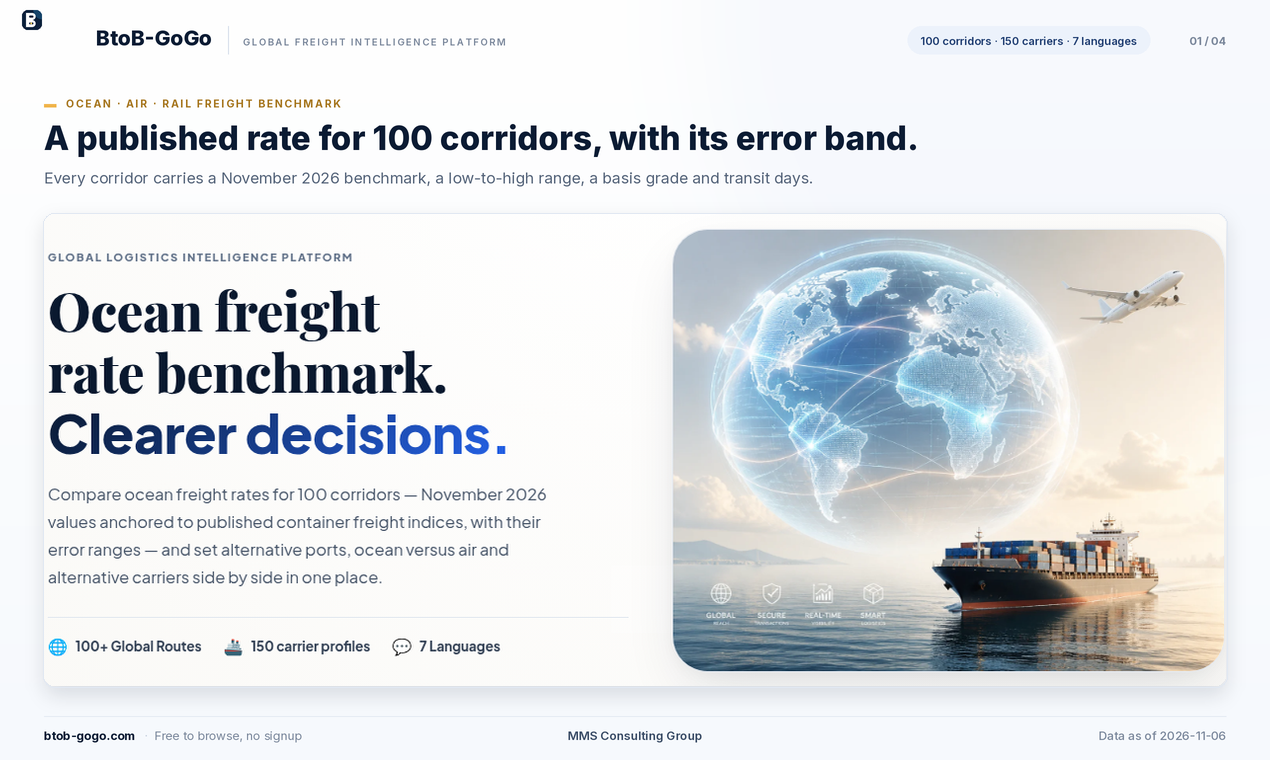
This post is about the record shape we settled on for the November 2026 BtoB-GoGo benchmark, the counting we did on our own output afterwards, and the places where the numbers stop on purpose. The benchmark covers 100 corridors (86 ocean, 7 air, 7 rail) and a 150-company directory, and it is published by MMS Consulting Group (엠엠에스컨설팅) at btob-gogo.com.
The record
The full file is public, and its header is the design:
corridor_id,mode,origin_code,origin,destination_code,destination,group,benchmark_usd,unit,low_usd,high_usd,error_band_pct,basis_grade,transit_min_days,transit_max_days,as_of
CR-001,Ocean,PUS,Busan,LAX,Los Angeles,Transpacific - US West Coast,8247,40FT FEU,7422,9072,10,K,12,15,2026-11-06
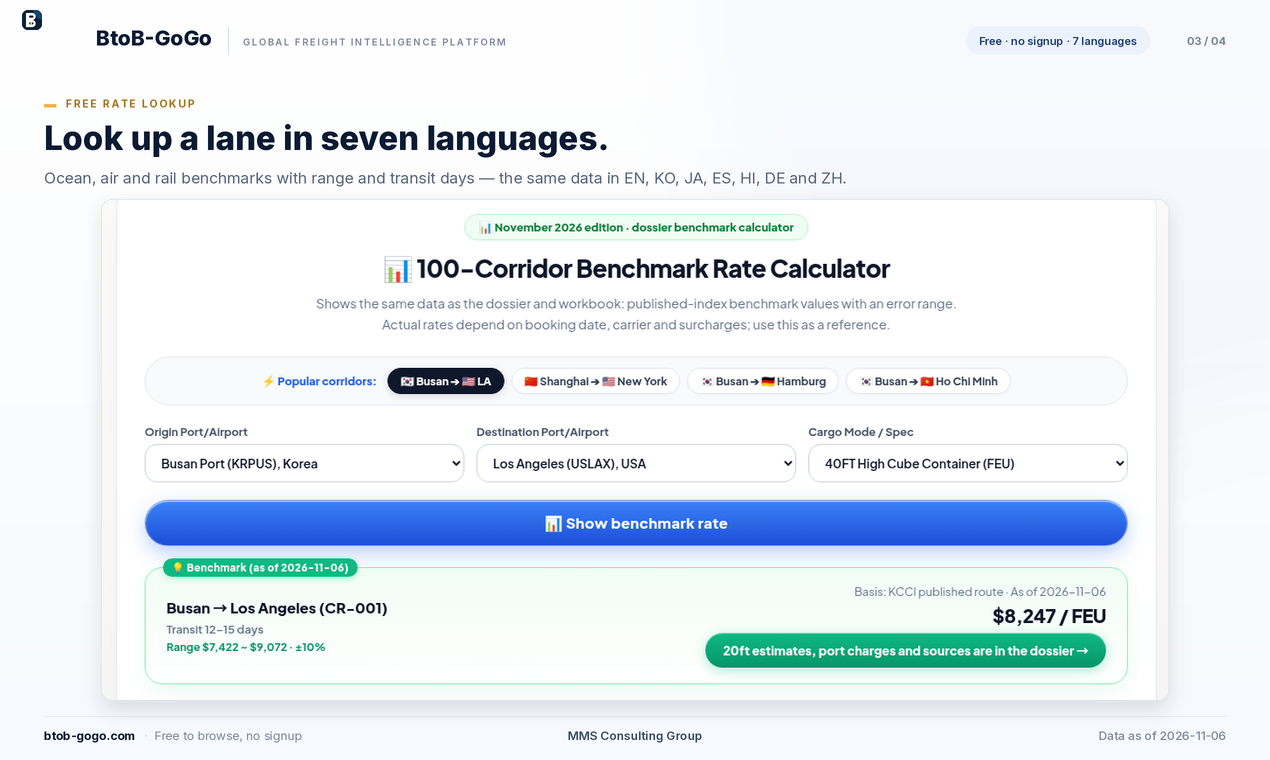
One row, read out loud: a benchmark of $8,247 per 40FT FEU, the interval it lives in ($7,422 – $9,072), the integer that produced that interval (10), the grade the number rests on (K), a transit range (12–15 days), and the date on which all of it is true (2026-11-06).
Three decisions in that header are worth naming, because each one closes an easy way to fool a reader:
- The error band is stored as a percentage of the benchmark, and
low_usd/high_usdare published beside it. Both are in the file, and a build check (below) verifies that they agree. Publishing only the band leaves consumers rounding; publishing only the range hides how wide it is relative to the price. unitis a field, not a convention. Ocean rows are per 40FT FEU, air rows per kilogram, rail per 40FT FEU. A pipeline that assumes one unit across the file corrupts itself quietly, at the join, months later.- Every row carries
as_of. A freight rate without a date is a rumour with formatting.
The grade ladder
Seven letters, each one an answer to "how far is this figure from a published index?":
| Grade | Basis | Band |
|---|---|---|
| W | Published index lane (Drewry WCI) | ±10% |
| K | Published KCCI route (Korea Ocean Business Corporation) | ±10% |
| D | Derived from a published anchor lane | ±25% |
| S | Scaled by the SCFI ratio | ±40% |
| A | Air, scaled from the TAC Index | ±35% |
| M | Internal model estimate | ±50% |
| N | Nearby corridor in the same region (pointer) | inherits |
The rule behind the widths is that the band follows the distance between the figure and a published source, not anyone's confidence about it. W and K are the index value for that lane on the recording date — nothing is inferred. D takes a published anchor and adjusts it to cover a corridor that has no direct quote. S applies an SCFI ratio across the network. A converts TAC air rates into a per-kilogram figure. M is a model estimate, and it is labelled as an estimate instead of being dressed up as an index. N is the honest edge case: where no anchor or neighbour lane exists, the record points to a nearby corridor in the same region and stays a pointer, rather than being converted into a number that looks local.
We counted our own bands
The interesting question about a grading system is not how it works but what it produces. A straight count of the published 100-row file:
| Grade | Band | Corridors |
|---|---|---|
| D | ±25% | 67 |
| M | ±50% | 11 |
| K | ±10% | 8 |
| A | ±35% | 7 |
| W | ±10% | 5 |
| S | ±40% | 2 |
Thirteen of one hundred corridors — 8 K and 5 W — are index lanes at ±10%. The other 87 are derived, scaled, model-based or pointers. The mean published interval spans 53.6% of its benchmark, and the median is 50%.
That second number is the one we would rather publish than hide. Where the bands are widest is structural, not accidental: all seven Eurasian rail lanes are grade M, so Yiwu → Madrid is published as $6,300 with an interval of $3,150 – $9,450; all seven air lanes are grade A at ±35%, so Shanghai (Pudong) → Frankfurt is $5.31/kg between $3.45 and $7.17. Air and rail are exactly the modes with the least published lane-level pricing, and the file says so in the only place a consumer will look.
A benchmark that claims uniform precision is lying by omission. Thirteen strong lanes plus eighty-seven labelled ones is a usable map; one hundred unlabelled numbers is not.
There is also a mechanical check we run on every build: in all 100 rows, low_usd and high_usd reproduce the stated band around the benchmark, with a largest deviation under 0.6 percentage points. It is dull arithmetic that catches the recurring bug — a rate gets revised during an update, the interval gets forgotten, and the record now advertises a precision it no longer has.
Using the band at the moment of decision
Three rules cover most of the value:
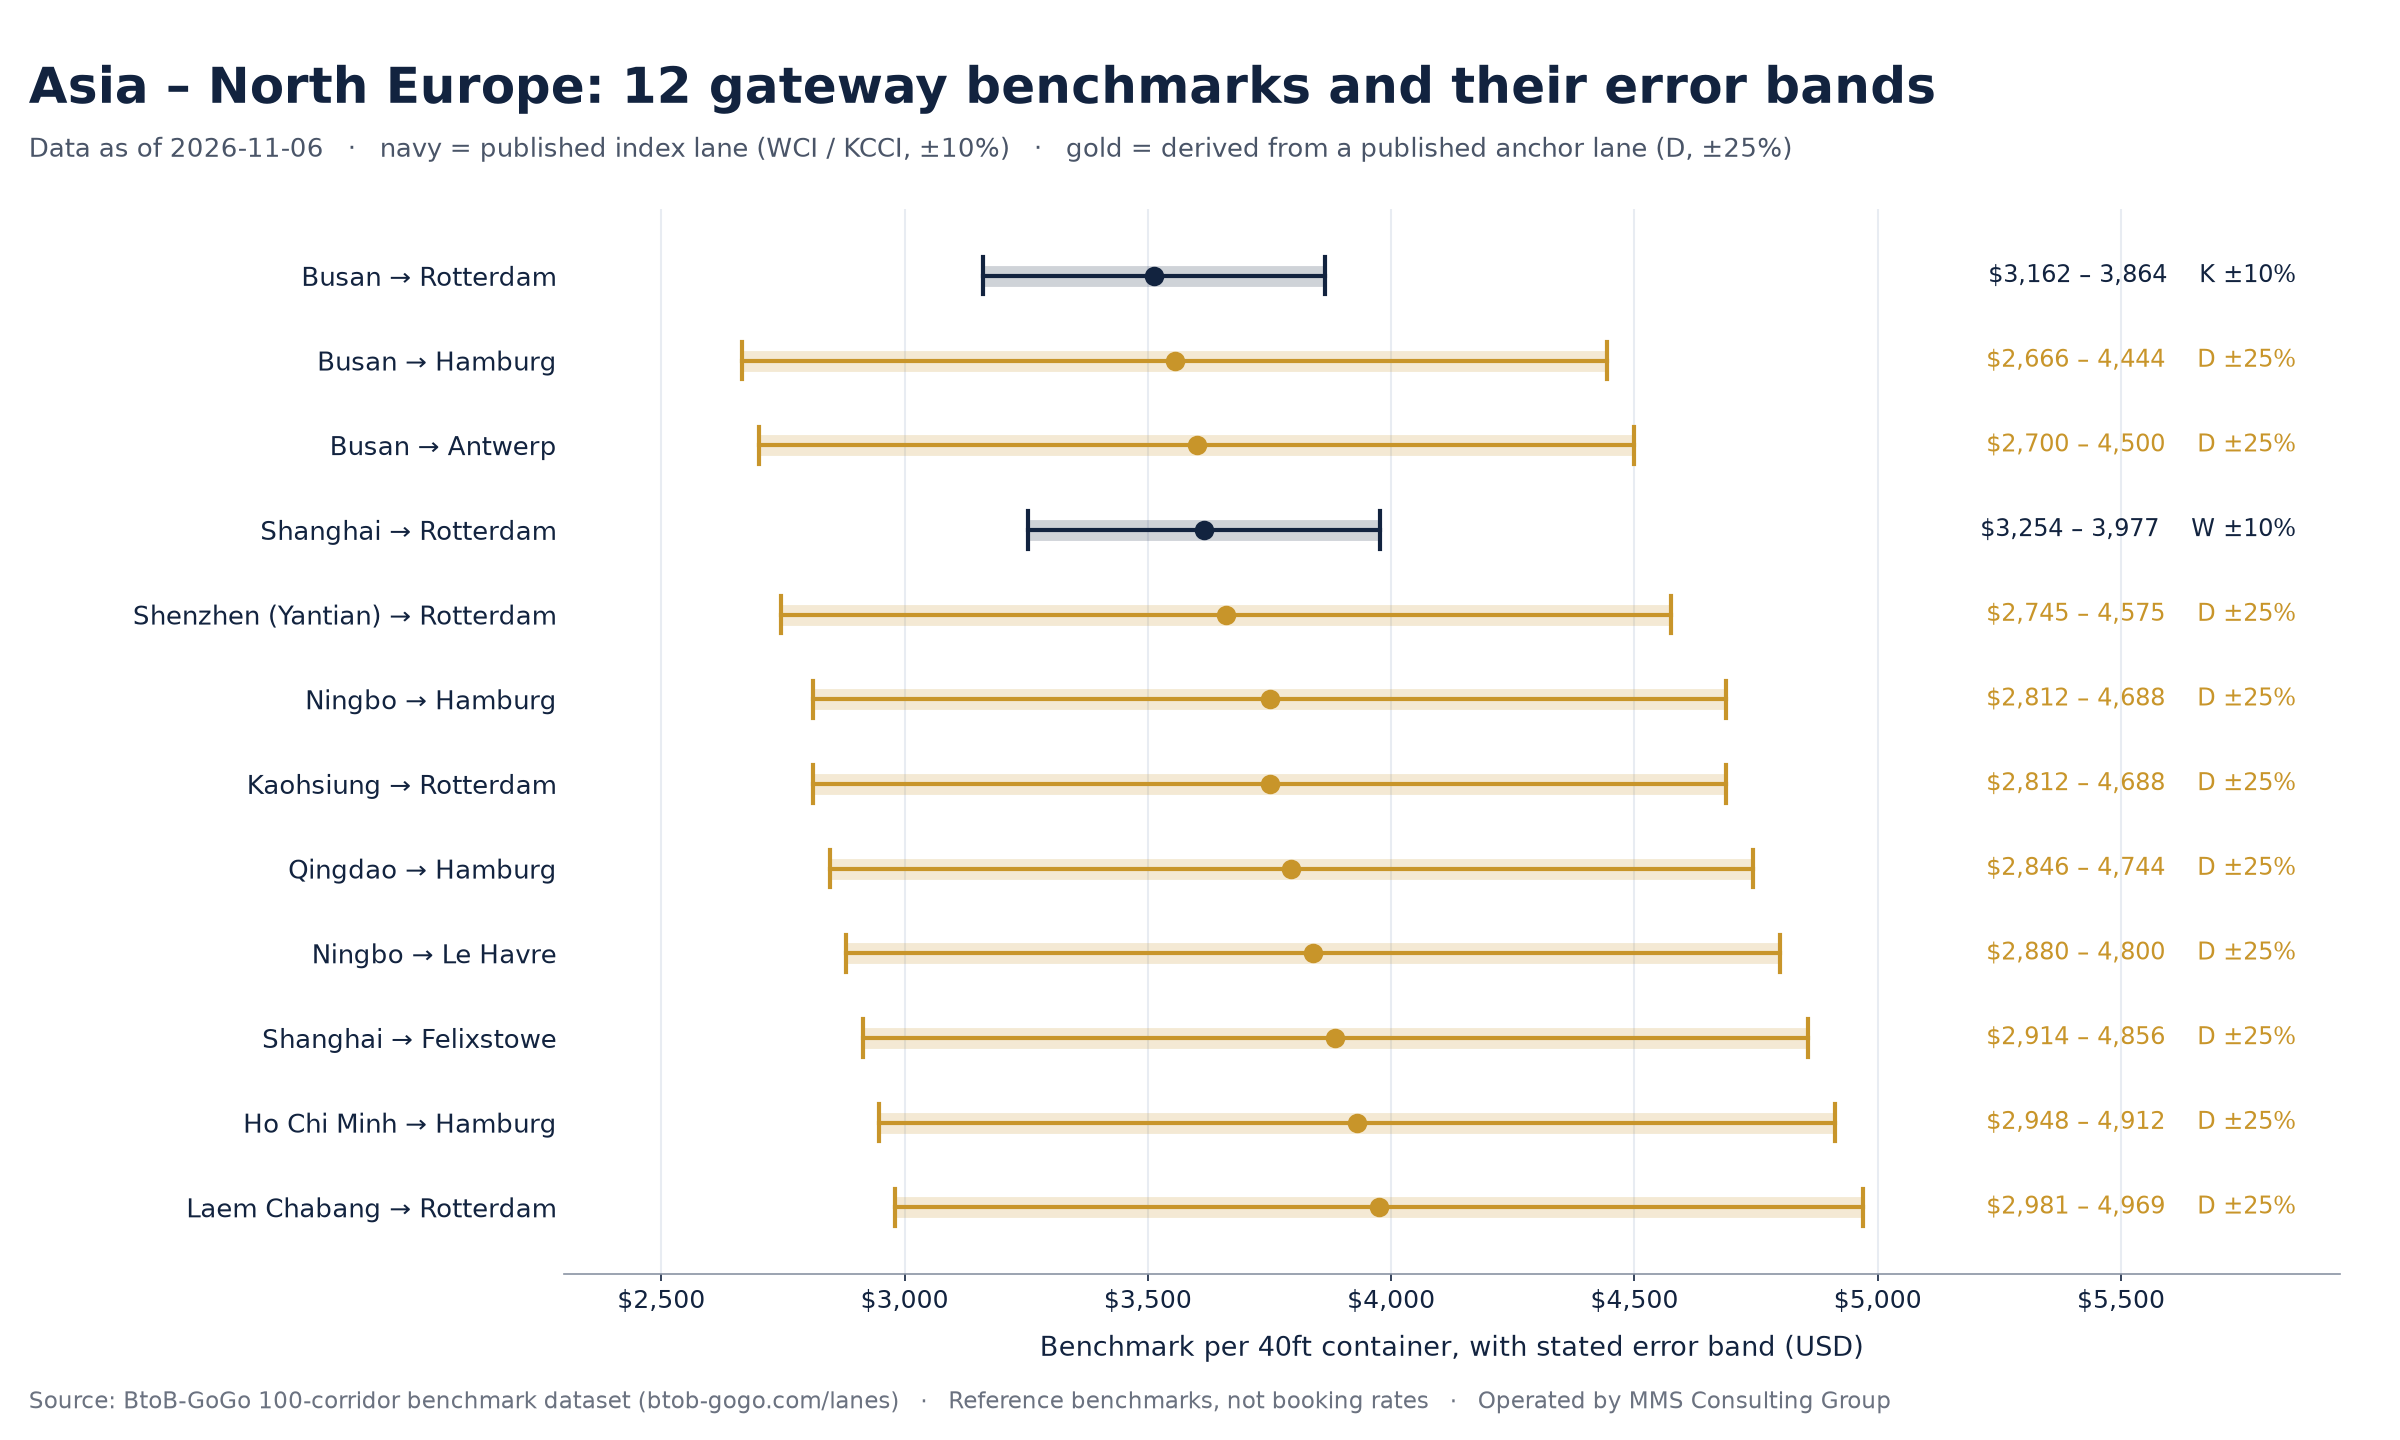
- Inside the interval, price alone cannot reject the quote. Busan → Hamburg is $3,555 at D ±25%, so $2,666 – $4,444. A quote at $4,100 sits inside, and arguing the base rate down from there is arguing with the market, not with the forwarder.
- Outside the interval, something other than the market is in the number. A $5,000 quote on that same lane is about 12% above the top of the band. Before negotiating the base rate, ask what is folded into the total: a THC, a fuel or emission surcharge, detention, or a booking date after the cut-off. The benchmark is not wrong in that case; it is being compared with a different object.
- Do not average across grades. The mean of a W row and an M row produces a number that carries neither row's evidence. If you must aggregate, add the endpoints — the sum of two intervals is the sum of their bounds — and label the result at the weakest grade in the sum.
The stakes scale with the lane. Busan → Houston is $11,805 at D ±25%, an interval of $8,854 – $14,756: on the most expensive corridors the band is worth thousands of dollars per box. That is why the grade belongs next to the price and not in a methods page three clicks away.
The benchmark is one line of the bill
The ocean element is a single line, and the rest of the invoice sits on top of it:
- Maersk's EMS is quoted at $170 per 40ft and its ESS at $190 per 40ft, effective 1 October 2026. On the $3,615 Shanghai → Rotterdam lane each of those is around 5% of the base rate — the same order of magnitude as the ±10% band on that index lane.
- Shanghai terminal handling is listed at CNY 890 per 40ft.
- The LA / Long Beach PierPass traffic mitigation fee is $40.63 per TEU from 1 October 2026.
A model that carries the band but drops the surcharges has reintroduced the very error it was built to remove. The surcharge rows are published on the same pages with source and effective date, so they get added deliberately rather than assumed away.
The second clock: free time
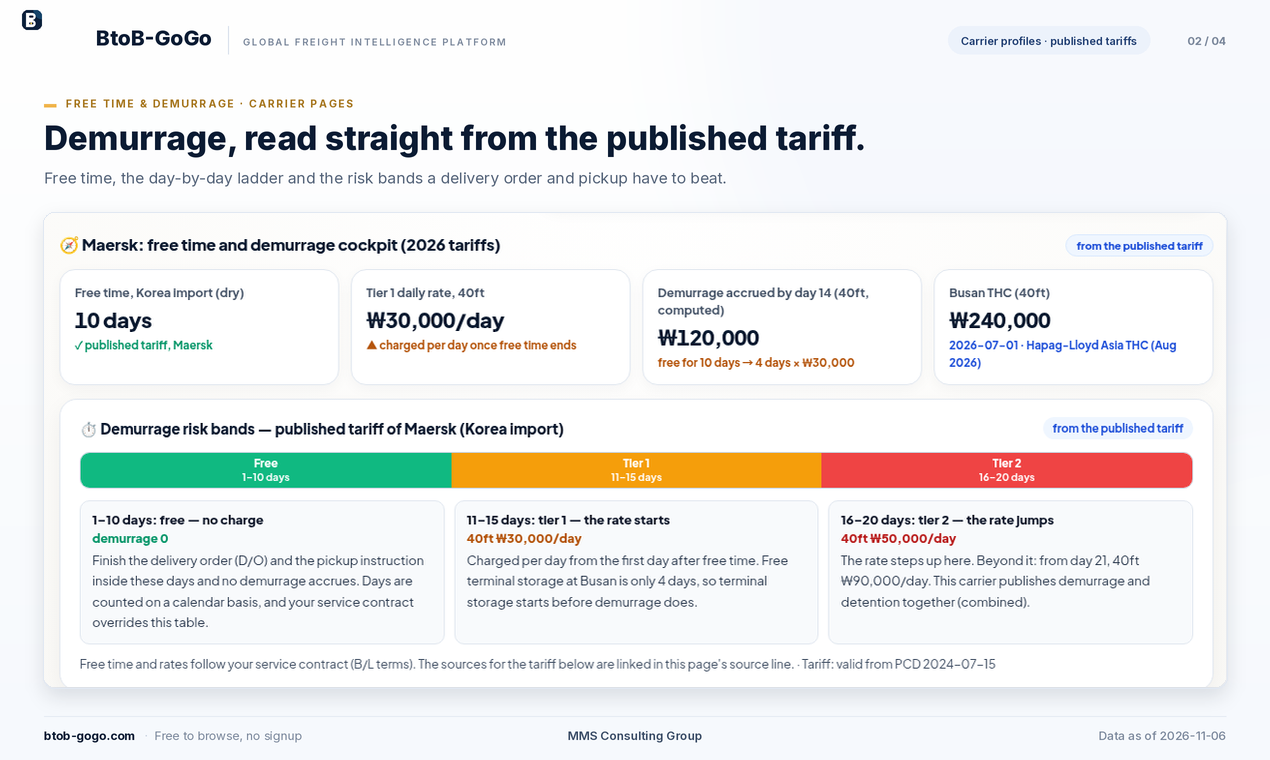
On the Maersk Korea import tariff, days 1–10 are free; days 11–15 cost ₩30,000 per day on a 40ft box, days 16–20 ₩50,000, and from day 21 ₩90,000 — demurrage and detention combined on that tariff. Cumulative by day 14, Maersk and Hapag-Lloyd sit at ₩120,000 while OOCL and COSCO Shipping Lines sit at ₩60,000; by day 21 the gap is ₩490,000 against ₩310,000. Free time itself is not uniform either: 10 days at Maersk and Hapag-Lloyd, 12 days at OOCL and COSCO on dry containers, with the same tier-1 rate of ₩30,000 per 40ft at all four.
The detail that actually decides the race is one line down: Busan terminal free storage is 4 days. Storage starts six days before demurrage does, so a model that tracks only the carrier's free time will be surprised by a bill the terminal sends.
And the caveat that belongs on every one of those pages: free time and overrun rates live in the service contract and the B/L, not in the tariff. That is also why each tariff row in the model carries an effective date — Maersk's Korea import table is valid from PCD 2024-07-15. A tariff row without an effective date decays silently, and nobody notices until a disputed invoice.
Company pages without a league table
The directory has 150 pages — 51 ocean carriers, 42 air, 38 forwarders and 3PL, 19 rail — and it ranks nobody. Three examples show how the evidence problem changes shape by company type:
- Forto, the digital forwarder in Berlin (independent private, VC-backed, 2022), publishes no tiered tariff of its own. Its page shows Maersk's published Korea import tariff and marks it plainly as reference only, because the alternative is attributing another company's numbers to Forto — which is how bad comparisons begin. See the Forto profile.
- Cathay Cargo, oneworld, Hong Kong, is an airline: airlines do not publish per-kilogram lane tables, so the page carries the TAC-anchored benchmark ($5.31/kg Shanghai–Frankfurt, ±35%, $3.45 – $7.17) alongside the rule that decides the actual invoice, chargeable weight being the greater of actual weight and 1 CBM ≈ 167 kg. See the Cathay Cargo profile.
- Kuehne+Nagel, 3PL and forwarder under Kuehne Holding in Schindellegi, quotes all-in per lane, so its page is built as a template for taking a quote apart. The Korean version is at btob-gogo.com/ko/carriers/kuehne-nagel; every page exists in seven languages with identical figures.
Each profile states group or alliance, headquarters, ownership checked against public sources, and schedule reliability — but only where the company publishes that figure itself, which five of them do. For everyone else the field is empty and says so. An empty field is information. A filled-in guess is a liability with a chart next to it.
The 370 side-by-side comparisons follow the same logic: alternative port, alternative alliance, air versus ocean. Carriers inside one alliance share schedules and space, which makes them weak substitutes for each other, so the alternative on the page is chosen from outside the alliance.
Where the numbers stop
- Cut-off. Indices and public documents published up to 6 November 2026, and every row carries that date. Corrections go into the following edition rather than being patched silently.
- Not a quotation. Actual rates depend on booking date, carrier, equipment and surcharges. Confirm a written quotation and the B/L terms.
- Not a forwarder or broker. The publisher does not quote or book cargo. That constraint is deliberate: it is what allows the error band to be shown instead of a number that sounds certain.
- Reliability is not punctuality. Where a figure exists it is monthly and vessel-level; lane variation, terminal waiting and feeder legs sit outside it.
- Gaps stay gaps. Anything that could not be verified is listed as a gap rather than filled with an estimate that inherits the look of data.
Data and access
- All 100 corridor rows as a free CSV, the same values as the site: data/benchmark-2026-11.csv, licence at btob-gogo.com/license.
- Seven languages with identical figures: en, ko, ja, es, hi, de, zh.
- llms.txt carries ten cite-ready corridor lines with their band and grade, so an assistant answering from these numbers keeps the band attached to the figure.
- The 2026 dossier adds a 30-port THC and surcharge reference to the 100-corridor data as PDF and Excel, in English and Korean: Basic $199 (list $299) / Premium $490 (list $700), 30% off the list price until 31 December 2026, ordered by invoice and bank wire.
BtoB-GoGo is published by MMS Consulting Group (엠엠에스컨설팅), whose Hashnode publication this is. If one thing from this post is worth copying, it is the cheapest one: keep the band in the same record as the number. Ours costs a single integer column.
About the author
- BtoB-GoGo publishes freight rate benchmarks with error bands and evidence grades: 100 corridors (86 ocean, 7 air, 7 rail) and a 150-company carrier and forwarder directory, in seven languages. Every figure carries the band it lives in and the grade it rests on. Published by MMS Consulting Group (엠엠에스컨설팅). Not a forwarder or broker.
Comments
Join the discussionPutting an evidence grade next to every figure is the part I wish more freight data did. When I compare a forwarder's quote to a benchmark, the quote is usually one confident number and the benchmark a vague range, so the comparison is mostly vibes. A band on both sides makes it obvious when a quote is inside normal noise versus genuinely off. One thing I'd love to see: a flag for what a rate includes (origin charges, surcharges, validity window), since two quotes can look 15% apart purely because of scope. Curious whether the grade reflects how recent the data is, or how many sources agree?
Thank you for reading it closely, and for naming the harder half of the problem: scope.
On the grade. It measures one thing only — how far a figure sits from a published source — and not how recent the data is, nor how many sources agree. W and K are index values for that lane (Drewry WCI, and the KCCI route) at ±10%. D is a published anchor adjusted onto a corridor with no direct quote, at ±25%. S scales an anchor by the SCFI ratio, A converts a TAC air rate to a per-kilogram figure, and M is a model estimate that says so in the column. Recency is carried separately: every row has an as_of date, currently 2026-11-06 throughout the file, and a correction goes into the next edition rather than being patched in place. Consensus across sources is not encoded yet; we would rather leave a cell empty than present one source as several.
On scope, you are right that it is where two quotes 15% apart usually come from, which is why the benchmark keeps surcharges outside the rate on purpose. Ocean rows are one element of a bill: origin and destination THC, Maersk's EMS ($170/40ft) and ESS ($190/40ft), and PierPass ($40.63/TEU) are published as separate rows with their own source and effective date, so a comparison does not quietly fold them in. A machine-readable inclusions field — origin charges, surcharges, validity window — is the honest next column for this table. It is not in the November edition, and we would rather say so than approximate it.
The corridor file (benchmark-2026-11.csv) downloads free from the data page of this publication's site, and the EU–Asia cut of the same data, gateway by gateway, is the report published here yesterday.
— BtoB-GoGo, published by MMS Consulting Group (엠엠에스컨설팅)